Ichimoku Buy/Sell Signals of manual MTF Tenkan crossing KijunIchimoku Buy/Sell Signals based on fast, small time frame Tenkans crossing longer timeframes Kijuns - Manual MTF Analysis
This code marks the potential change of direction based on the input of one timeframe's Ichimoku Tenkan (conversion) line crossing over a higher, longer timeframe's Ichimoku Kijun (base) line.
Feel free to change the inputs if need be and to hide the yellow box. Use Ichimoku rules of Tenkan, Kijun, Lagging Span, and Cloud for Take profit/Stop Losses. It is best to wait 3-5 minutes after the signal to enter to confirm the trend and to confirm if the Lagging Span has broken key levels. I refer to the book Trading with Ichimoku - A Practical Guide to Low-Risk Ichimoku Strategies by Karen Peloille as the Ichimoku rulebook. Good luck.
For day trading/scalping/intraday - 1min/3min/5min
Tenkan Line Timeframe = 1min
Kijun Line Timeframe = 5min
For swing trading - multiple days/weeks - 4HR/Daily/Weekly Charts
Tenkan Line Timeframe = day
Kijun Line Timeframe = week
Cari dalam skrip untuk "Buy sell"

BTC buy/sell effectivenessDescribing how much bitcoin price moves due to active buy/sell orders, using price data from BINANCE:BTCUSDT but summing up the volume data from BINANCE:BTCUSDT, COINBASE:BTCUSD, BITHUMB:BTCKRW, BITFLYER:BTCJPY, KRAKEN:BTCEUR, FTX:BTCUSD, BITSTAMP:BTCUSD, BITFINEX:BTCUSD. The script is based on another script in the following
The recommended setting is 1m resolution with 1H time frame, EMA lengths 12 and 18. The upper and lower dashed lines show regions of high and low volatility of price.

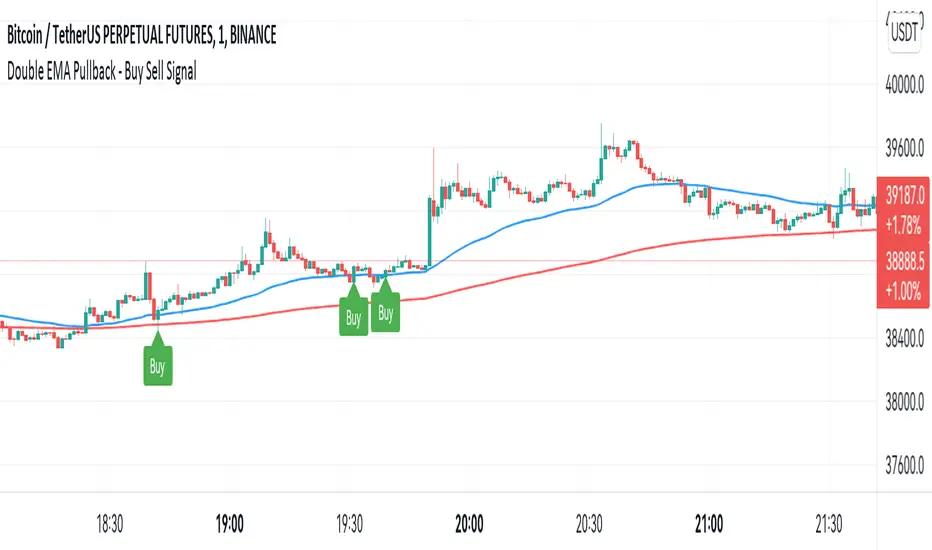
Double EMA WIth Pullback Buy Sell Signal - Smarter AlgoBuilt with love "Double EMA With Pullback Buy Sell Signal "
This indiator will help you to find a Double EMA Pullback Signal
You can combine with your own strategy, or use this purely
DISCLAIMER :
Measure the risk first before use it in real market
Backtest The Strategy was very important, so you know the probability
Fundamentally Logical :
Pullback (Some Previous candle is Red for Bull Pullback vice versa)
the Entry candle must be a Candlestick Pattern
Features :
1. Double EMA
2. Pullback Signal
How to use it :
1. Adjust the Pullback Backstep
2. Adjust the EMA Period
3. Adjust the Style to your preferences
Regards,
Hanabil
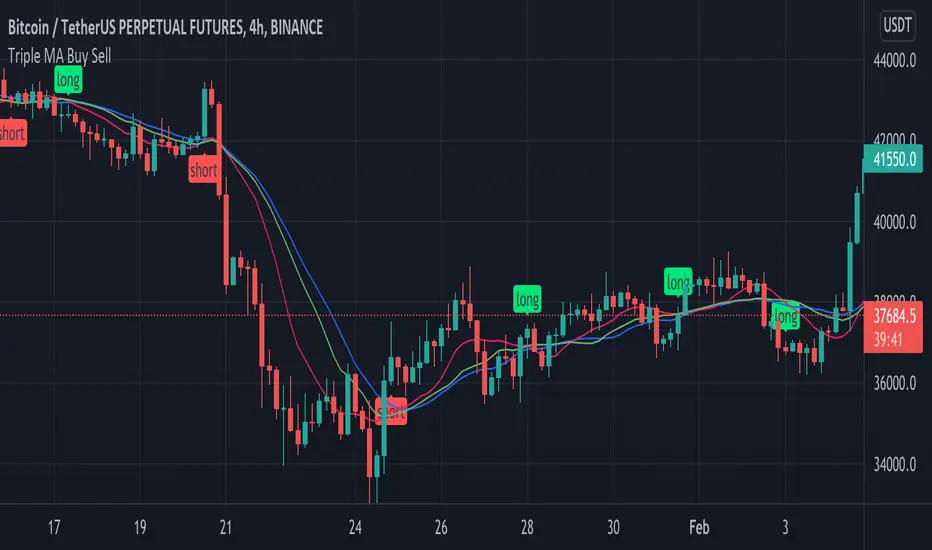
Triple MA Buy SellThis simple script show potentiel trade entry points using 3 MA, can be switch by EMA and SMA type.
Adjust the MA(s) Length depending pairs and timeframe you use.
Buy & Sell labels can be display by input settings.
Action are take by the following rule:
Long signal:
MA3 > MA2 > MA1
Short signal:
MA1> MA2 > MA3
Add some filters is really needed to make this usable.
using my "Flat Detect By Bollinger Bands" indicator can be a debut
EURUSD INTRADAY BUY/SELL TRADING SIGNALS INDICATOREURUSD INTRADAY BUY/SELL TRADING SIGNALS INDICATOR
The Forex intraday trading indicator is specially designed for prediction and scalping EURUSD .
A feature of this indicator is the use of specially designed filters that filter out noise.
Thus, the efficiency and performance of the indicator has been improved. BUY and SELL signals show reversal points of local intraday trends,
and allowing scalping on the price movement.
The SELL indicator signal corresponds to the indication of a downward trend reversal.
The BUY signal corresponds to the indication of a trend reversal upward.
The principles of operation of the signal filters algorithm and refinement of entry points into positions are described below.
The indicator is based on a combination of the following indicators: MACD, Moving Average of various periods.
We use MACD divergence confirmation to identify a possible reversal or weakening of the trend.
Divergence (divergence of indicators) usually occurs when the indicator moves in the direction,
different from the price dynamics.
This could indicate that the momentum of the current trend is weakening.
When the price of the EURUSD currency reaches a higher price high,
while MACD is making a lower high. This is divergence.
After identifying the divergence, using the classic MACD crossover.
To filter signals, use the maximums of the MACD indicator,
in combination with the crossing of the Moving Average line.
This forex indicator is designed for trading on the EURUSD currency pair, timeframe: 45 minutes.
The forex signal indicator is intended for active traders of the EURUSD currency and will be useful as a supplement to any trading system, to indicate and clarify entry points to trading positions.

BBW EMA RIBBON+BB%B+EMA BUY/SELL SignalsBINANCE:BTCUSDT
* * * TESTED ON BTCUSDT 4H CHART * * *
The indicator gives signals based on possible ENTRY/EXIT zones (calculated using an ema ribbon of the BBW) and BB%B oversold/overbought conditions, also a 200 EMA filter is used to trade following the major trend.
ENTRY/EXIT zones can be used as a confirmation on other strategies (green zones suggest a possible entry for a long in an uptrend and for a short in a downtrend, red zones suggest a possible exit for long & short)
Only LONG signals are given.
Signals are divided in 3 categories based on their strenght:
- Weak BUY/SELL (green/red circles on chart)
- normal BUY/SELL (green/red triangles with "BUY" or "SELL" text on chart)
- strong BUY/SELL (green/red labels with "STRONG BUY" or "STRONG SELL" text on chart)
You can use signals from the same category as triggers for entering or exiting a trade or you can try using signals from different categories
All indicators settings can be costumized
Possible EXTRY/EXIT zones can be turned ON/OFF
Every signal label can be turned ON/OFF
EMA that changes color based on last candle close can be turned ON/OFF
Alerts can be set for:
- General Signals (every signal will trigger it)
- Weak Signals (only weak signals will trigger it)
- Normal Signals (only normal signals will trigger it)
- Strong Signals (only strong signals will trigger it)
There are 3 BB%B Oversold & 3 BB%B Overbought value presets:
- BASIC (default values)
- LOW (slightly lower values from default)
- HIGH (slightly higher values from default)
Tips:
Use BB%B OS LOW preset to find entries at a better price
Use BB%B OS HIGH preset to find entries faster
Use BB%B OB LOW preset to find exits faster
Use BB%B OB HIGH preset to find exits at a better price
There are 3 Filters already included:
- A checkbox to toggle ON/OFF the use of Heikin Ashi candels to detect trades
- A checkbox to toggle ON/OFF the use of an ema filter for the ribbon that tries to reduce the number of false signals on over-extended price movements
- A checkbox to toggle ON/OFF the use of an ema filter that tries to reduce the number of false signals when price crosses the moving average many times consecutively

BB+RSI+EMA BUY/SELL SignalsBINANCE:BTCUSDT
* * * TESTED ON BTCUSDT 4H CHART * * *
The indicator gives signals based on candles touching BB lines and RSI oversold/overbought conditions, also a 200 EMA filter is used to trade following the major trend.
Only LONG signals are given.
Signals are divided in 3 categories based on their strenght:
- Weak BUY/SELL (green/red circles on chart)
- normal BUY/SELL (green/red triangles with "BUY" or "SELL" text on chart)
- strong BUY/SELL (green/red labels with "STRONG BUY" or "STRONG SELL" text on chart)
You can use signals from the same category as triggers for entering or exiting a trade or you can try using signals from different categories
All indicators settings can be costumized
Every signal label can be turned ON/OFF
EMA that changes color based on last candle close can be turned ON/OFF
Alerts can be set for:
- General Signals (every signal will trigger it)
- Weak Signals (only weak signals will trigger it)
- Normal Signals (only normal signals will trigger it)
- Strong Signals (only strong signals will trigger it)

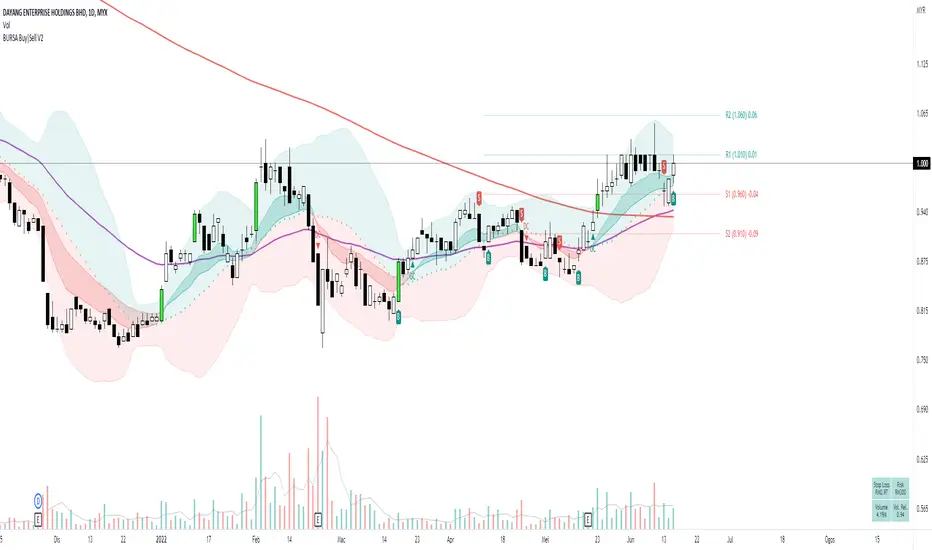
[HuD] BURSA Buy|Sell V1My main problem when I first started trading is to decide where is the best entry point and where should I sell it.
So using ATR and ema lines I build this indicator which I hope it can guide trader to make that decision.
This indicator contains :
I. Bollinger Band with standard-setting
- Green Zone indicates a positive trend, while red is negative trend
2. Moving average line ( I recommend using ema ) which are ema5,10,20, 50 and sma200
- ema10 and 20 are represented by green ribbon ( when its uptrend = ema10 is bigger value than ema20 ) and red ( when its downtrend)
- I'm also using ema7 and ema 21 as guides for the beginning of uptrend/downtrend. Represented by a green and red triangle
3. Default ATR setting is 10 with 1 multiplication
4. Buy Sell signal represented with labels B and S
- It acts as a guide on where to make the entry or exit. It acts as a guide and traders can decide to Entry at BUY signal and exit at SELL signal.
- Traders can also consider taking the BUY entry even after they miss the BUY signal if the price did not close lower than the opening price of BUY candle, which is 2 to 3 candles after the signal.
- SELL signal acts as a guide when it breaks the trailing stop line. Traders will have the option to exit the trade if they follow this signal or wait for another 1 or 2 candles.
5. Breakout Candle
- when the candle breaks the highest level of the previous 5 candles with volume > average 5 days, the candle's color will change to lime green.
6. Line High and Low ( need to turn on at setting menu )
- act as support and resistance guide
7. EMA Crossing
There is an option to display the Golden Cross (GC) and Death Cross (DC) of ema lines such as :
Golden Cross (GC) - Green Label
- EMA5 Crossover EMA20
- EMA20 Crossover EMA50
- EMA50 Crossover MA200
Death Cross (DC) - Red Label
- EMA5 Crossunder EMA20
- EMA20 Crossunder EMA50
- EMA50 Crossunder MA200
8. Table Info will display :
- Stop Loss Information
- Risk
- Current Volume
- Relative Volume. If relative volume > 1, means the current volume is higher than normal volume. For example, if RV = 5, meaning current trading volume is very active and it's 5 times higher than average volume.
This is only version 1 and will be upgraded from time to time. Hope this indicator can help traders in making wise decision in trading.
Wavy Tunnel + Trend ATR Buy Sell Signal by PaRnWavy Tunnel + Trend ATR Buy Sell Signal by PaRn
Originality by PaRn
First Combination of Wavy Tunnel + Trend ATR Buy Sell Signal by PaRn
"Buy Sell Signal" is base on Volatility Stop 20, Multiplier 2.5
"Trend Signal" is based on EMA crossover between EMA12(Close) and EMA26(Close)
Take Profit Line is EMA15(Default)
Wavy line Base on EMA34(high,close,low)
Tunnel line Base on EMA144(close),EMA169(close)
Green Candle Bar = "Uptrend"
Red Candle Bar = "Downtrend"
Buy when "Buy" Signal present
Follow Trend till the end of the trend : "Sell" Signal present
Buy More (Optional) = Green Arrow present on Uptrend
How to use Wavy Tunnel + Trend ATR Buy Sell Signal by PaRn
- Wavy Tunnel + Trend Signal can be used in any timeline from 5 Minutes to Weeks
- Price above both Wavy & Tunnel = "Uptrend"
- Green Candle Bar = Uptrend
- Buy when "Buy" Signal present
- Buy More (Optional) = Green Arrow present on Uptrend
- Hold your possition and Follow Trend till the end of the trend : "Sell" Signal present, It's time to sell all position
NOT RECOMMEND TO USE ON SIDEWAY MARKET

Realtime Volume Bars w Market Buy/Sell/Neutral split & Mkt Delta
What is it?
A tool that shows Real-time Volume bars split into 3 components: (1) Market Buy Volume - i.e., the volume that got transacted on upticks; (2) Market Sell Volume - i.e., the volume that got transacted on downticks;
and, (3) Neutral Volume - i.e., the volume that got transacted without a change in price. (This feature can be turned off if you want normal volume bars).
Market delta (i.e., Market Buy Volume - Market Sell Volume) is also displayed above each volume bar. (On by default; can be switched off from Settings)
The split and Market Delta data are ONLY AVAILABLE FOR REAL-TIME BARS. Historical bars are shown just like regular ones. The dotted line marks the start of real-time data (i.e., the bar from which the indicator started collecting and displaying data). You will see accurate data for bars to the right of this line. The longer you keep a chart open with the study enabled, the more data it collects and displays, and the better your analysis can potentially be.
Note that the data gets reset every time any of the options is changed, the market is switched, the browser is refreshed, or the script is reloaded
DATA ISN'T STORED. I.e., every time a new symbol is loaded, the previous symbol's data is lost. So if you intend to monitor a symbol, you would need to keep it loaded all the time.
Who is it for?
For traders who are used to analyzing buy/sell activity using market buy/sell volume and market delta information
Although you can use this independently as well, use it in conjunction with "Market Delta Volume for Realtime Bars" indicator to get a better visual representation of the numbers.

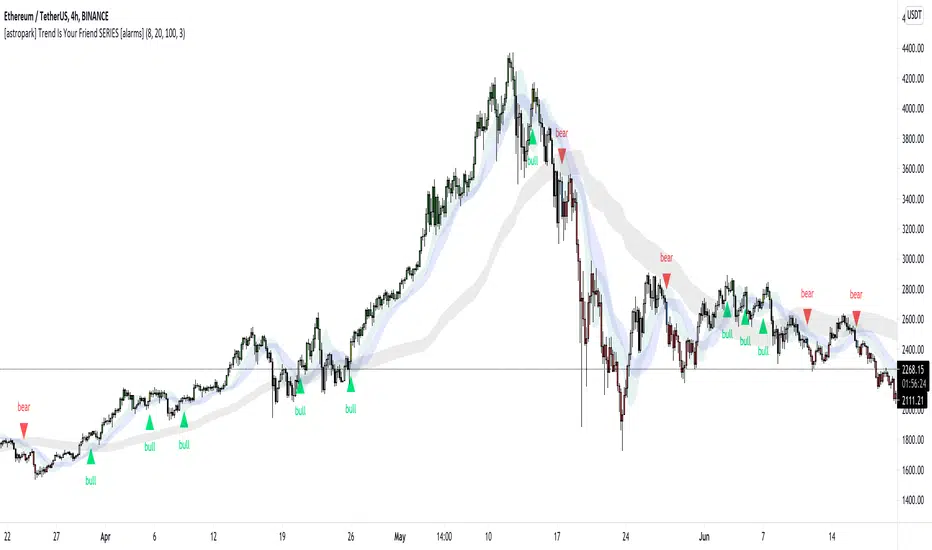
[astropark] Trend Is Your Friend SERIES [alarms]Dear Followers,
today I'm glad to present you an indicator which is a mix of three indicators of mine: Trend Is Your Friend Series !
As you may easily understand from the name, this indicator incorporates all 3 Trend is You Friend indicators I made in past.
This way you can control all of them just with one indicator.
Of course this comes with some useful integration features:
a bull green triangle appears when all trends are bullish (you can set an alert for this)
a bear purple triangle appears when all trends are bearish (you can set an alert for this)
bar coloring reflects the bullish/bearish integration too
you have an option to enable/disable all trends buy/sell signals
you have an option to hide trend clouds borders (chart will be way cleaner this way)
you can still customize each trend indicator settings and set alerts on each trend individually
you can enable/disable heikin ashi analysis
As per Trend is Your Friend V1/V2/V3, this indicator is for higher timeframe trading, from 4h and above is suggested.
This indicator is pretty good for both Swing and Scalping , you can run it over a bot or use it on Renko chart!
If you are a scalper, you will love suggested entries for fast profit. You can run it on 1h timeframe in this case (below is not suggested, there is "no-trend" below 1h!). If you are used to scalp trading, be sure to close each trade whenever you feel happy (a proper trailing stop strategy is suggested for example).
As I always say, all tools are great if you use them correctly: this is not the "Holy Grail", so always use proper money and risk management strategies.
For your reference, here you can see original basic indicators that were integrated here:
V1 backtesting strategy
V2 backtesting strategy
V3 backtesting strategy
This is a premium indicator , so send me a private message in order to get access to this script.
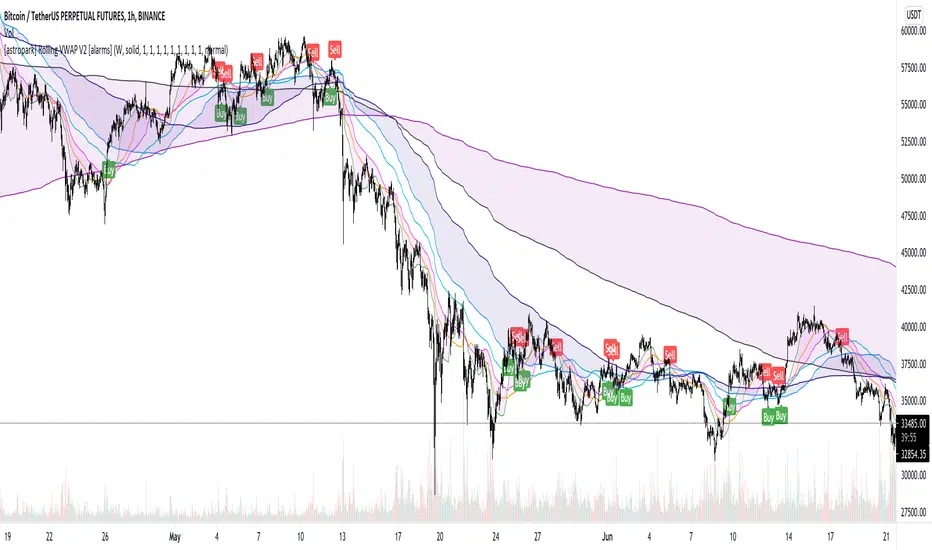
[astropark] Rolling VWAP V2 [alarms]Dear Followers,
today I'm glad to present you yet another awesome Analysis Tool and Strategy, that you may like to use in your trading journey: Rolling VWAP V2 !
This is an upgraded version of my "Progressive VWAP" analysis tool (progressive and rolling are synonymous for me), its description describes quite well what a progressive/rolling vwap is and why they are important to watch:
This indicator can print automatically for you many important Rolling VWAPs:
Daily (D)
2 days (2D)
3 days (3D)
4 days (5D)
Weekly (W)
2 weeks (2W)
Monthly (M)
Quarterly (Q)
Yearly (Y)
As an indicator it will let you:
enable/disable each rolling vwap, change its color and line style and thickness
enable/disable labels and/or price on labels, as well as change their size
As a strategy it will let you:
enable/disable buy/sell signals
choose which strategy to use (all based on rolling vwaps of course)
choose a starting date & time from which to start backtesting
enable/disable individually long and short setups in the backtesting
You should choose low timeframe rolling vwap strategy if you are on a low timeframe, while higher timeframe rolling vwaps are good on medium-high timeframes.
For example D-2D-3D rolling vwap strategies are good at 1h or below, the others on higher timeframes. Backtesting results will help you in understanting this point quite easily.
This indicator works on every timeframe, market and pair. By the way it must be said that, as a bot strategy it has been tested and designed mostly for Bitcoin trading and it works best on 1h or above.
As I always say, all tools are great if you use them correctly: this is not the "Holy Grail", so always use proper money and risk management strategies.
This indicator is the alarms version of the backtesting one you can see here below:
This is a premium indicator , so send me a private message in order to get access to this script.
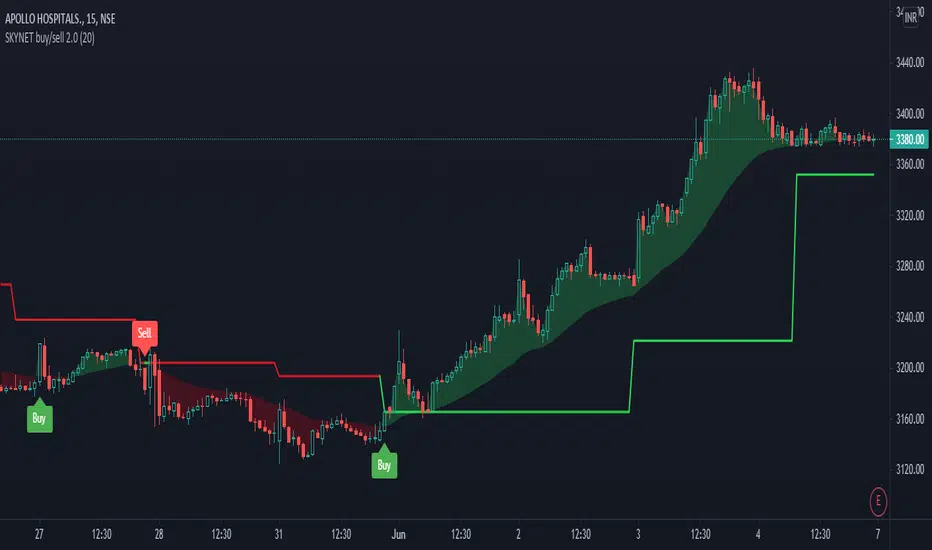
SKYNET buy/sell 2.0The SKYNET buy/sell 2.0 indicator generates buy and sell signals based on the following conditions:
**Anchor line : This anchor line is calculated based on certain parameters.
The anchor line is calculated in such a way that the stock/instrument moves around this anchor line.
The calculation of the anchor line uses a look back period which is set to 9 by default. The user can go to the indicator settings and change it to suit their trading style.
Note:
1) As the look back period increases, the number of signals generated on the chart decreases.
2) This indicator will only work on charts/stocks/instruments which are actually traded in the market i.e actual contracts of the stock/instrument is traded in the market. Hence, it will not work on indexes.
BUY signal: When the stock/instrument deviates to the upside of the anchor line by a specific margin, the Buy signal is generated.
SELL signal: When the stock/instrument deviates to the downside of the anchor line by a specific margin, the Sell signal is generated.
Disclaimer: This indicator is not 100% accurate and false signals are generated from time to time. Trading in the markets involves huge risks and one should always do his/her own research before making any trading decisions. This indicator is only designed to help you make a trading decision.
AIOC Indicator [Armand Snyman] V7All In One Chart Indicator V7
The All In One Chart Indicator (AIOC) consists of the following:
-BB is a Big Buy signal which means the price is going to go up really fast. The BB is there to alert you if the price goes up a lot and that it is going to happen fast.
-BS is a Big Sell signal which means the price is going to go down really fast. The BS is there to alert you if the price goes down a lot and that it is going to happen fast.
-Buy
-Sell
-Pump zones is the blue background color.
-Dump zones is the purple background color.
HOW TO USE THIS INDICATOR!
It is very simple to use this indicator. If a buy signal comes through you long or enter the market and if a sell signal comes through you short or exit the market.
If a Big buy signal comes through you long or enter the market and if a Big sell signal comes through you short or exit the market.
If a pump zone (the blue highlighted color on the background) comes in, then it is safe to enter the market or to enter a long position.
If a dump zone (the purple highlighted color on the background) comes in, then it is safe to exit the market or to enter a short position.
HOW THE BUY, SELL, PUMP AND DUMP SIGNALS ARE CALCULATED!
Using a combination of moving averages and the rsi and the macd.

Angle Attack Follow Line Indicator This indicator works with Follow Line Indicator , evaluates the angle for possible additions or reductions of the position. Many settings to play with:
s3.tradingview.com
- FOLLOW LINE CURRENT CHART RESOLUTION
- FOLLOW LINE HIGHER TIME FRAME
- FILTER HIGHER TIME FRAME
- NO FILTER HIGHER TIME FRAME
- ANGLE CONFIGURATION
- ANGLE LEVELS
- BUY / SELL
- OPTIONS TO ADD
- OPTIONS TO REDUCE
- BAR COLOR
- LABELS
-ALERTS
MANAGE YOUR RISK AND CAPITAL WELL IF YOU DO NOT WANT TO LOSE EVERYTHING¡¡¡
TO PLAY¡¡¡

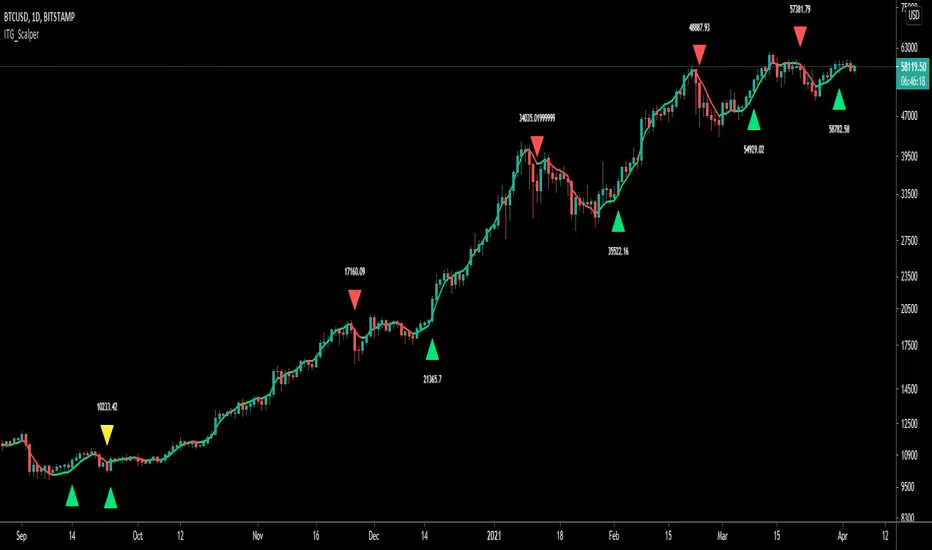
ITG ScalperITG Scalper by Complector.
Inspired by Juboal-Rabaroansa Perosteck Alseyn Balveda dam T'seif
Methology:
- I am using a TEMA (triple EMA) to determine the local trend direction and to give buy & sell signals when the trend changes.
- An optional filter, using moving average convergence divergence (MACD), can be switched on to filter out 'false' signals.
- The calculation of the TEMA does not request data from a resolution higher or lower than the resolution of the main charts symbol,
However, the filter function does, if another resolution is chosen for the filter.
- Persistent variables are used for buy and sell prices, enabling color-coding of the sell-signal (profitable or not).
Features:
- Color coded TEMA - bullish=green , bearish=red
- Buy/Sell indicator - Sell indicator: green=profit, yellow=loss
- Optional noise filter
- Optional variable time-frame for noise filter
Remarks:
In my experience, the default values works best on the daily time frame. I encourage everyone to experiment with the values for best results.
Using the script on non-standard charts (Heikin Ashi, Renko etc.) can produce unrealistic results.
Using a resolution higher or lower than the main charts symbol for the filter can possibly lead to repainting.
Thanks to Iain M. Banks for making my life richer :-)
MA200W buy sell BTC ColoredA script to help you plan your entrances and exits with beautiful colors for BTC. It just helps to better highlight the gap between the start of the week and the end.
It only work on Weekly.
Info :
Blue ... you can wait, enjoy your life
Green is when you buy
Yellow when you enter bull market
Orange is when you begin to take care of next week
Red when you begin to sell low part
White, if while a week you see white you can sell bigs bags, if it end with White you can close majors positions
Warning White may not appear, if second week after first Red week is not White you can sell large position
Good luck and take a breath

ToTitans : Buy/Sell HHVWhat is it
It is a volume profile indicator base on y axis. It will show you when the buy/sell volume dominate the market
Differentiation
No one has done this before to calculate buy/sell volume indicator in this fashion
This indicator has been used in AJ Jim class for "Type 2" approach
Suitable for
Intra Day Trading (20m-2h)
TFEX:S501!
"PM me to obtain access"

© 2021 - SwingSwiss - BUY/SELL© 2021 - Dan Chetrit - BUY/SELL"
Product Description:
The Indicator combines the Relative Strength Index, Moving Average Convergence Divergence as well as Volume and Stochastic.
The idea is to cross multiple data and signals from these indicators in order to trigger buy when crossing above and sell when crossing below the signal line.
The idea was also to find a mathematical function that will trade the convergence of these lines trying to predict the market.
This indicator works better on a daily chart.
The indicator works long and short but is better for long positions.
The script also includes an EMA 50 line as well as an overbought/oversold RSI background.
The indicator can be used on every type of market: indices, stocks, cryptocurrencies, currencies, and others but, according to backtesting, it works better for the US stock market.
This study is not a guaranteed profit. You should backtest or trade virtual money before using this study on your real portfolio, as it is intended to be a tool. Do your research and learn about the company you are investing in.
Disclaimer:
Trading and investing in the financial markets involves substantial risk of loss and is not suitable for every investor.
All trading strategies are used at your own risk.
Please send me a private message or comment on TradingView to gain access to the script.

{INDYAN} Perfect Buy SellA simple indicator based on candle stick strength, with cpr,vwap and support resistance...
search for buy sell signal on 15 min timeframe and wait for second candle to close above/below of signal candle. Cpr pivots would act as support and resistance. Entry should only be based on 15 mins or higher timeframe. 3 and 5 mins timeframe for profit booking.
No supertrend or atr used in this indicator.
This show how a single candle can give u good trade...
Love Indyan
* tested on Banknifty and nifty , kindly share ur experiences on other scrips. Thanks
PRIO Trend FollowingWith this indicator you can generate automatic BUY-SELL signal on your chart and trade with an ease. This is a trend following indicator based on HIGH-LOW ema channel. You can choose ema period from the input menu on settings, and add to your favourite time frame.

Long Short | Buy Sell IndicatorThis indicator is based on an adaptive RSI. You can change one setting, the period. The period means, how many past bars are included in the calculation of the indicator. Be aware, that the period needs to be the same or less than the available past bars of your trading pair. The indicator works on every timeframe. The past data bars are repainted, but the real time indicator should just give you valid buy and sell alarms.
The indicator includes:
- buy / long signals
- sell / short signals
- buy and sell prices
- results of trades
- alarms for buy and sell
Please try it out at first with no money or something. Just set alerts for buy and sell and check the performance of the indicator afterwards, maybe it is a good strategy for you with your settings.
Greetings,
snurk
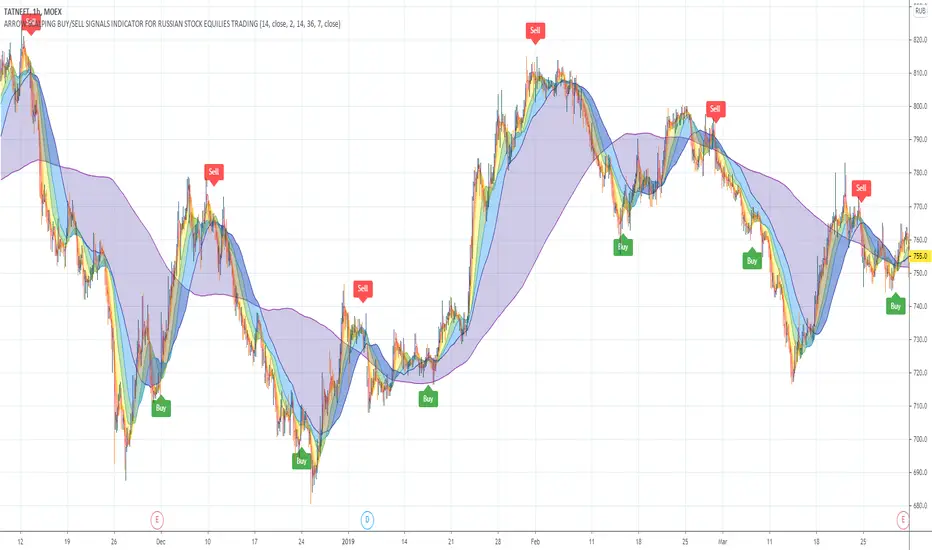
ARROW BUY/SELL INDICATOR FOR TRADING TATNEFT ON MOSCOW EXCHANGEThe arrow buy / sell signals indicator is specially designed for trading on the Moscow Stock Exchange MOEX with shares of commodity and energy companies such as TATNEFT MOEX:TATN .
When developing the indicator, the nature of price movements and the volatility model of TATNEFT shares were taken into account, which made it possible to develop an indicator with refined signals that most effectively predicts the future price movement of shares of energy companies, in particular, TATNEFT MOEX:TATN .
The indicator signals are filtered, and the most accurate signals are reflected on the chart as buy / sell arrows.
The indicator is suitable for intraday trading on the 1H timeframe.
This script indicator can be used as an independent trading system, and can also complement your trading system and increase its performance.
For the development of the indicator, such basic indicators as: Simple Moving Average, RSI, MACD, Bollinger Bands.
The indicator parameters are optimized based on historical data on the price movement of energy companies' stocks, in particular TATNEFT MOEX:TATN using testing.